The EV Charging Curve: Why “X kW Peak” Is the Biggest Lie on the Spec Sheet
The charging number they show you at the dealership is useless. And they know it.
“250 kW charging!” “800-volt architecture!” “The fastest-charging EV on the market!” That huge number heading up every ad, that peak kilowatt figure they hand you with pride, is the most misleading spec on the whole sheet. Because an electric car doesn’t charge at a constant rate. It charges along a curve. And that peak they sell you? It holds it, if you’re lucky, for under a minute. What actually decides how long you stand at an interstate charger is the shape of that curve, and hardly anyone explains it. For an American driver who road-trips real distances on Electrify America, EVgo, and Tesla Superchargers, this is the number that matters most. Let’s fix it.
What the charging curve is, and why it’s never flat
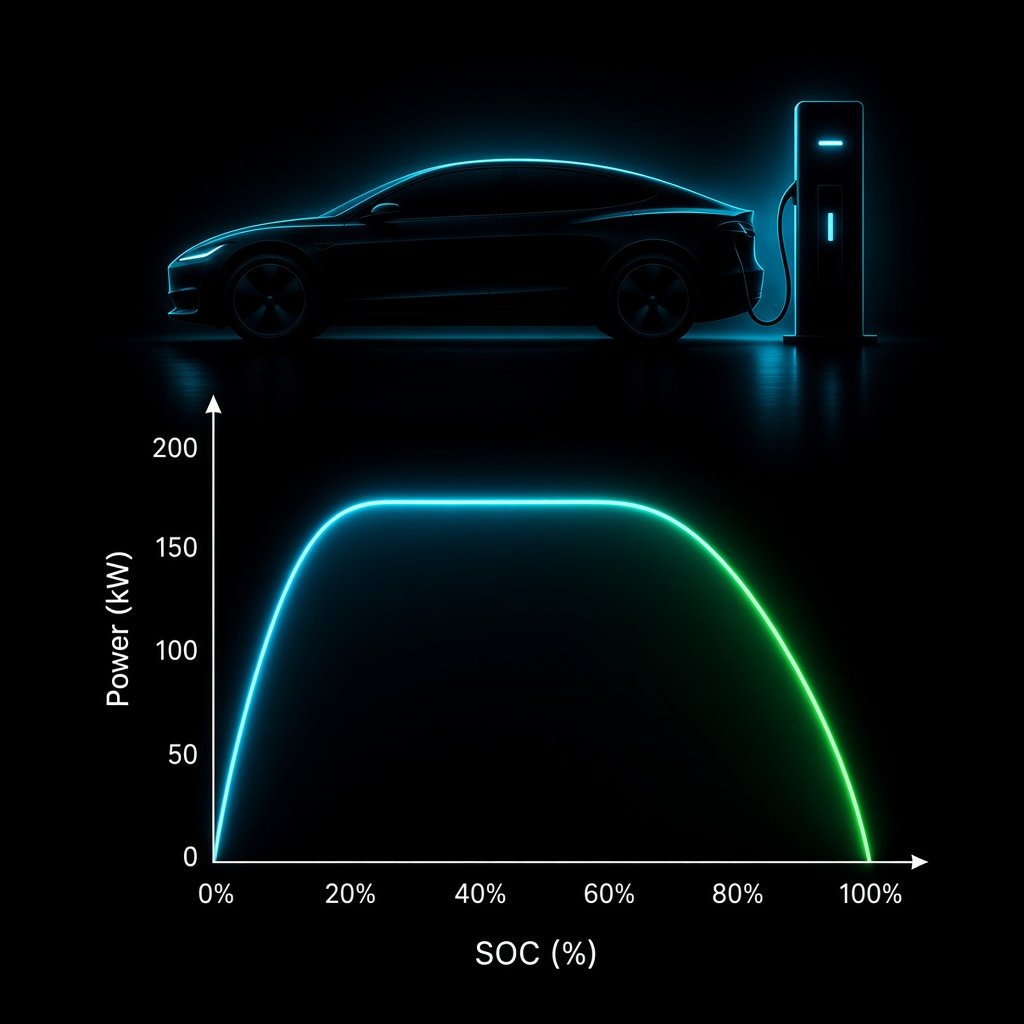
Picture a graph: along the bottom, the battery level, 0 to 100%. Up the side, charging power in kilowatts. If you plot how an EV charges on a fast charger, you never get a straight line. You get a mountain: power is highest when the battery is nearly empty, holds for a while, then falls off as the battery fills.
This isn’t a flaw or a fault in your car. It’s the pure physics of lithium-ion batteries. As the cells fill, their internal voltage rises and the gap the charger can push current across narrows. The battery management system, the BMS, deliberately steps the power down to avoid excess heat and the dreaded lithium plating, a deposit of metallic lithium that would damage the cell forever. The power drop isn’t the car misbehaving; it’s the car protecting itself.
And here’s the key that changes everything: that dazzling peak only happens in a narrow window, way down low, with the battery nearly empty. It lasts a breath. The rest of the time you’re charging well below that number. Judging a car by its peak is like judging a gas car by the top speed printed on the speedometer: a real number you’ll almost never use.
The figure that actually matters: the 10-80% average
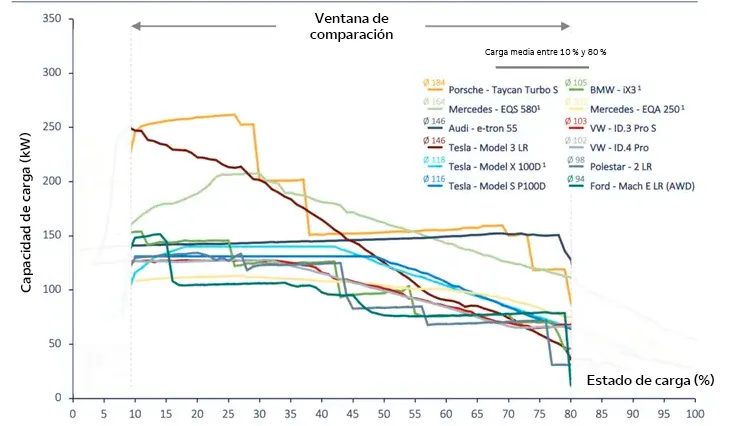
Automakers compare fast charging from 10 to 80%, not 0 to 100%, for a specific reason. Below 10% you charge blisteringly fast but you arrived there sweating, and above 80% charging slows so much it’s not worth the wait. That 10-80% stretch is the one you actually do on a trip, and the figure that counts isn’t the peak but the average power the car sustains across that whole window. That average sets your real stop time, and on average a car holds only around 70% of its quoted peak across that window. Some hold far less.
And when you look at the average, the world flips. The Hyundai Ioniq 5 advertises a 263 kW peak, but its real average over that stretch runs about 205 kW. The Tesla Model 3, with a higher 250 kW peak, averages barely 107 kW, because it touches that peak for a few seconds at low charge and then collapses past the halfway mark. The Porsche Taycan, peaking around 320-325 kW, sustains an average north of 280 kW, the strongest on the market, which is why it finishes 10 to 80% in under 20 minutes.
The most revealing case is the BMW i4 and i5. Their peaks top out at 205 kW, lower than plenty of rivals bragging bigger numbers. And yet they beat them, because their curve is flatter: they hold high power across almost the whole charge instead of spiking and crashing. A car with a “worse” peak that charges faster than one with a “better” peak. That’s the whole trick, and it’s proof that the big brochure number doesn’t tell you who reaches 80% first. Independent benchmarking bears it out: in P3’s testing the Taycan added around 383 km of real range in a 20-minute stop, with the Ioniq 6 and Kia EV6 close behind, all of them 800-volt cars that hold their power instead of spiking and dying. The pattern is consistent enough that the shorthand writes itself: ignore the peak, read the 10-to-80 time, and the pecking order rearranges completely.
The rookie mistake that costs you time: arriving with too much battery
Here’s a tip worth more than any spec, and almost nobody gives it. Plenty of drivers pull into a charger at 45 or 50% because they’re nervous about running low. On a long trip, that’s exactly the wrong move.
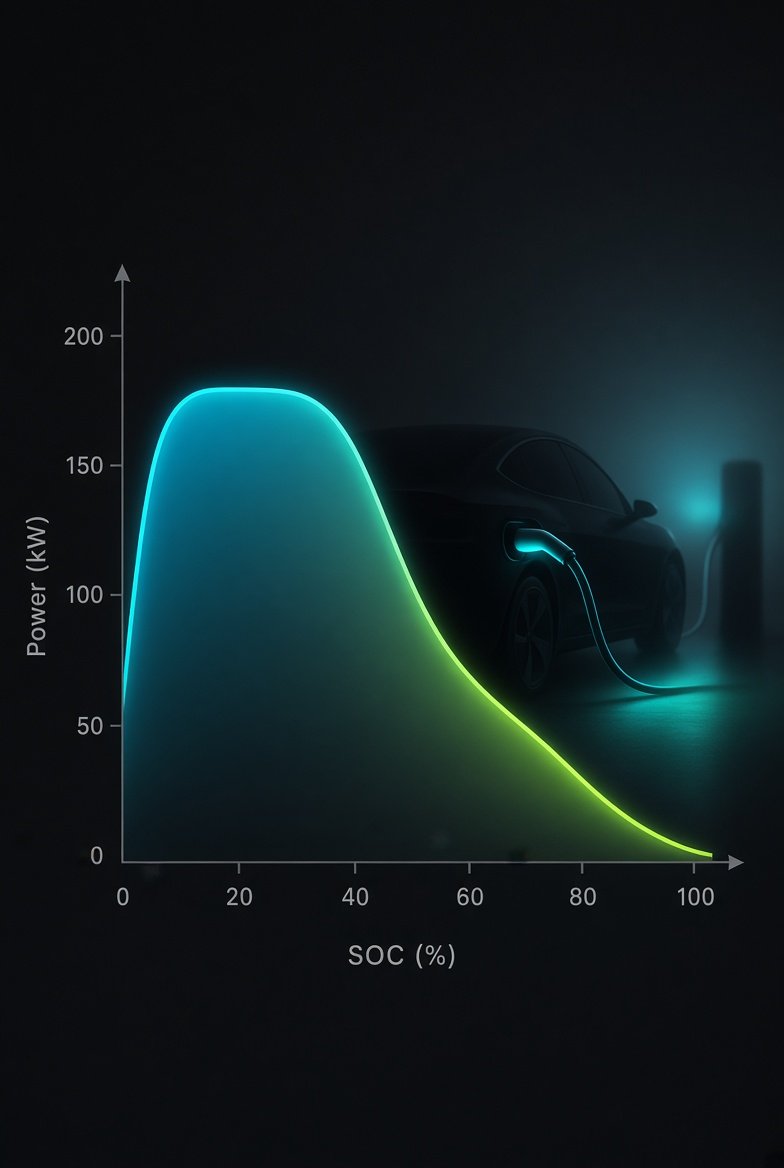
Because charging power is highest with the battery low and falls as it fills, arriving at 45% drops you straight into the slow zone of the curve, where the car is already charging at half throttle. Arrive instead at 10 or 15% and you use the whole high, powerful part of the curve, and you leave sooner. Running the battery down a little more before you stop, within a sensible margin, can shave several minutes off every stop. That “charge early just in case” instinct is punishing you. The flip side matters too: a bigger battery simply needs more energy to cross the same 10-to-80% window, so headline peak aside, pack size quietly shapes how long you wait. Recovered range in a fixed time, not percent, is the straight yardstick when the packs differ in size.
The other big myth: “10-80% in 18 minutes”
When an automaker tells you “10 to 80% in 18 minutes,” they’re not lying, but they’re showing you the perfect photo under lab conditions. And there are two traps worth taking apart.
First: that figure is 10 to 80%, not 0 to 100%. Almost no EV charges from empty to full in anything like that time, because the last stretch, 80 to 100%, can take as long as the entire first half. Above 80% the BMS cuts power in half, and above 90% it can drop it to a quarter. On a road trip, sitting to charge from 80 to 100% on a fast charger is one of the worst calls you can make: you pay twenty-plus minutes for 20% of battery, and you block the charger for the driver behind you. Charge to 80%, unplug, keep driving.
The second trap is temperature, and it’s huge. Those brochure figures assume a warm battery, around 25-35°C. A cold battery physically cannot accept full current. A car rated for 250 kW can drop to 80-120 kW at -10°C with no prep. Cold can cut fast-charging speed by 40 to 80%. That’s why two people in the exact same car can see wildly different charging speeds: one arrived with the pack at temperature, the other with it frozen. If you charge through a Midwest winter, this isn’t theoretical, it’s every stop. The temperature ladder is steep: around 50-70F a battery accepts full rate, at freezing it drops to roughly 70-80% of maximum, at 14F to 50-60%, and at -4F it can crater to 30-40% or worse. In deep cold a pack may even refuse to reach a full 100%, capping out around 80-85% as its own heating and cabin warmth eat into the charge.
The secret weapon almost nobody uses right: preconditioning
Here’s the feature that separates the drivers who know from the drivers who suffer: battery preconditioning. It warms the pack to its ideal temperature before you reach the charger, so it accepts full power from the first second instead of trickling in.
The trick is as simple as setting the charger as your destination in the car’s own navigation. Do that, and the car starts warming the battery on the drive so it arrives ready. A preconditioned pack can jump from accepting 30-50 kW cold to over 100 kW, cutting a 10-80% charge from nearly an hour to closer to half an hour. It’s why, in winter, two identical cars charge at speeds from different planets: one showed up warm, the other didn’t. And there’s a bonus almost nobody knows: preconditioning doesn’t just charge faster, it protects the battery, because cold-charging punishes a pack more than the small thermal cycle of warming it. A note for the LFP crowd, which now includes standard-range Teslas and some Fords and Rivians: that chemistry is even more cold-sensitive than NMC and throttles charging harder still when it’s freezing.
The concept that levels the field: C-rate
Now the technical nuance that dismantles the rigged kilowatt comparison, because comparing two cars by peak kW alone is like comparing two gas pumps by liters per minute without ever checking the size of the tank.
C-rate measures charging speed relative to the size of the battery, not in absolute kilowatts. A big pack can swallow a lot of kilowatts without strain, while that same number in a small pack would be brutal. So C-rate is a far truer measure of the real effort than raw kW: it counts the work being asked of the cell, not the figure on the sign. And because that stress depends on state of charge, not pack size, every battery spends roughly the same fraction of the curve in the slow zone, big or small.
The example that nails it: the Audi e-tron and the Subaru Solterra both advertise a 150 kW peak. The Subaru has the smaller battery, so in theory it should charge faster. It doesn’t: in independent tests the Audi hit 80% in 30 minutes and the Subaru needed 38, and the Audi added more energy in the same time. Another: the Ford F-150 Lightning, peaking at 150 kW, and the Tesla Model 3, at 250 kW, deliver almost the same average power, about 105 versus 107 kW. The Tesla only finishes sooner because its pack is smaller, not because its curve is better. The big number, again, lied to you.
So how do you actually compare a car by its charging?
Forget the peak. It’s the top speed on the speedometer: real, impressive, and useless for your daily life.
Look at three things. First, the 10-80% time, the only figure that reflects a real road-trip stop. Second, if you’re unsure, hunt down independently measured charging curves, the ones that plot real power across the whole charge and show you whether the car holds its nerve or deflates halfway. And third, how much real range you recover in, say, 20 minutes, which is what you care about in the end: miles back in your pocket for every coffee you drink.
Here’s the closing shot, and I won’t soften it: you’ve spent years dazzled by a number a car holds for less time than it takes to read it. Peak kilowatts is the figure that sells the most and matters the least. Next time a salesman jabs “250 kW” in your face like a medal, ask the one question that disarms the trick: fine, and how long from 10 to 80% with the battery at temperature? That’s where the brochure ends and the truth begins. Because the peak makes the ad, but the curve makes the charge.
Unplug and enjoy.
1 thought on “EV CHARGING CURVE”